Please have a look on the statement below and it’s result. It represent a real application. I changed the table names to protect the privacy of my customers, but kept the meaning of the tables intact. The statement below is very usefull to sketch the characteristics of an application very quickly. It picks the statements showing the highest activity. This tables are likely to be the central elements of the schema you research. It also shows how these tables are supported by the phisical design and the application code. That way it is a kind of a I/O map of an application.
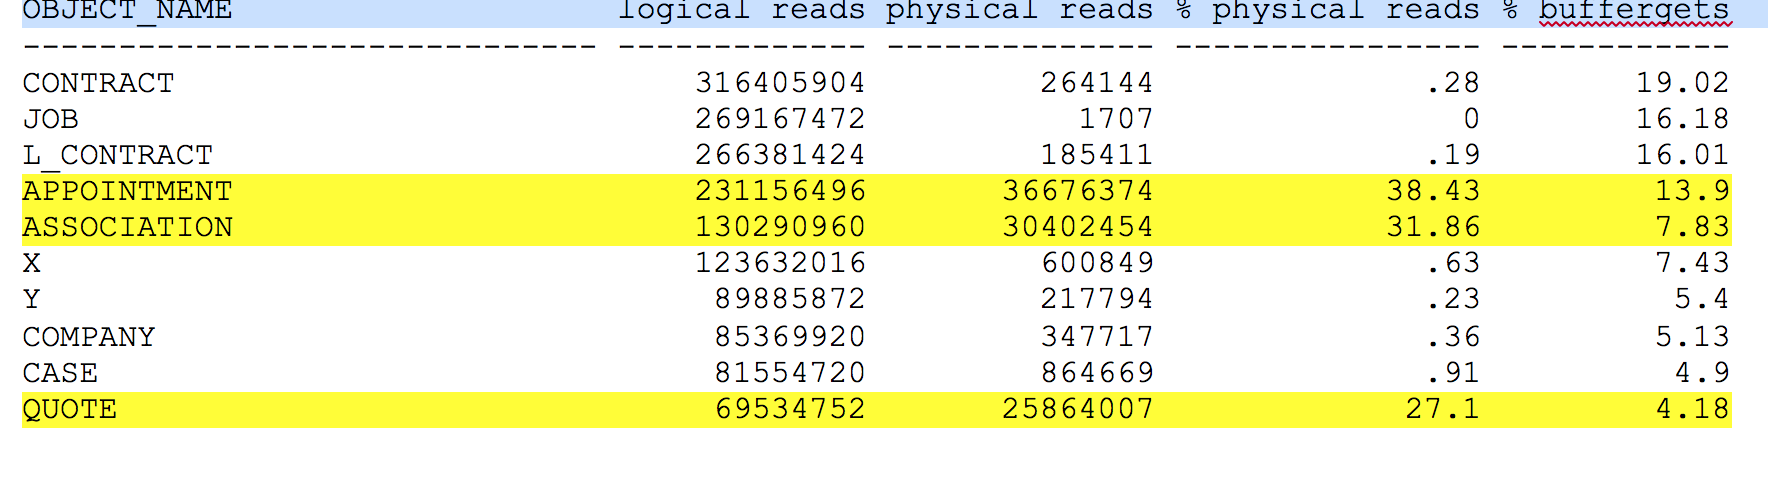
I created the statement more or less by accident and was surprised, how usefull it is. The result below is typical. Inituition would suggest that the I/O is distributed evenly across all tables. In real life this is rarely the case. The use of the application leaves it’s footprints in the activity pattern. Adding up percentages we reveal , that 97% of physical I/Os results from a few tables. It is beneficial to investigate in more depth. How would you proceed?
1 select OBJECT_NAME, "logical reads","physical reads",

2 round(ratio_to_report("physical reads") over ()* 100,2) "% physical reads",

3 round(ratio_to_report("logical reads") over ()* 100,2) "% buffergets"

4 from

5 (select OBJECT_NAME, sum(decode(STATISTIC_NAME,'logical reads', value ,null)) "logical reads",

6 sum(decode(STATISTIC_NAME,'physical reads', value ,null)) "physical reads"

7 from v$segment_statistics

8 where owner='&owner'

9 and STATISTIC_NAME in ('logical reads','physical reads')

10 and OBJECT_TYPE ='TABLE'

11 group by OBJECT_NAME

12 order by "logical reads" desc)

13* where rownum < 11